Hello! I’m a coder, designer all in the name of data visual journalism.is a news app and data visuals developer at the Texas Tribune with a focus on elections and political data. Previously, I was a data and interactive visuals journalist at NJ.com and The Star-Ledger in New Jersey. I was born in Chile and moved to the U.S. when I was seven. A couple of years later, my family settled in Florida where I went to high school and college. I am currently based in Austin, Texas.
Skills
Proficient in HTML, CSS, Javascript – D3.js and Node.js, Illustrator, QGIS, Python for data analysis and web scraping and Django for back-end development.
Fluent in Spanish and English.
Contact me
Work I've Done
Below are selections of my best work. To see a comprehensive list, visit here for work I've done for The Texas Tribune and here for work I've done for NJ.com.
Election results: How Texas voted in the November 2022 midterms
The election results page for the 2022 midterms in Texas which includes live updating vote counts for Texas races along with maps and regional breakdowns of results. The data was scraped from an API provided by Decision Desk and added to a Django app that updated a JSON with new results every five minutes. View
Role:
front end development
data scraping
back end development
Skills: html css react d3 node.js python django
Skills: html css react d3 node.js python django
In Texas, where money has long dominated politics, Greg Abbott is in a league of his own
A comprehensive look into the campaign finance donations received by Texas Governor Greg Abbott. It includes analysis of 25 years of campaign finance data to support the reporting. Several graphics show the extent of the donations received, in particular from donors who have given more than $1 million to his campaigns. View
Role:
data analysis
public records requests
design
front end development
Skills: html css javascript node.js illustrator python
Skills: html css javascript node.js illustrator python
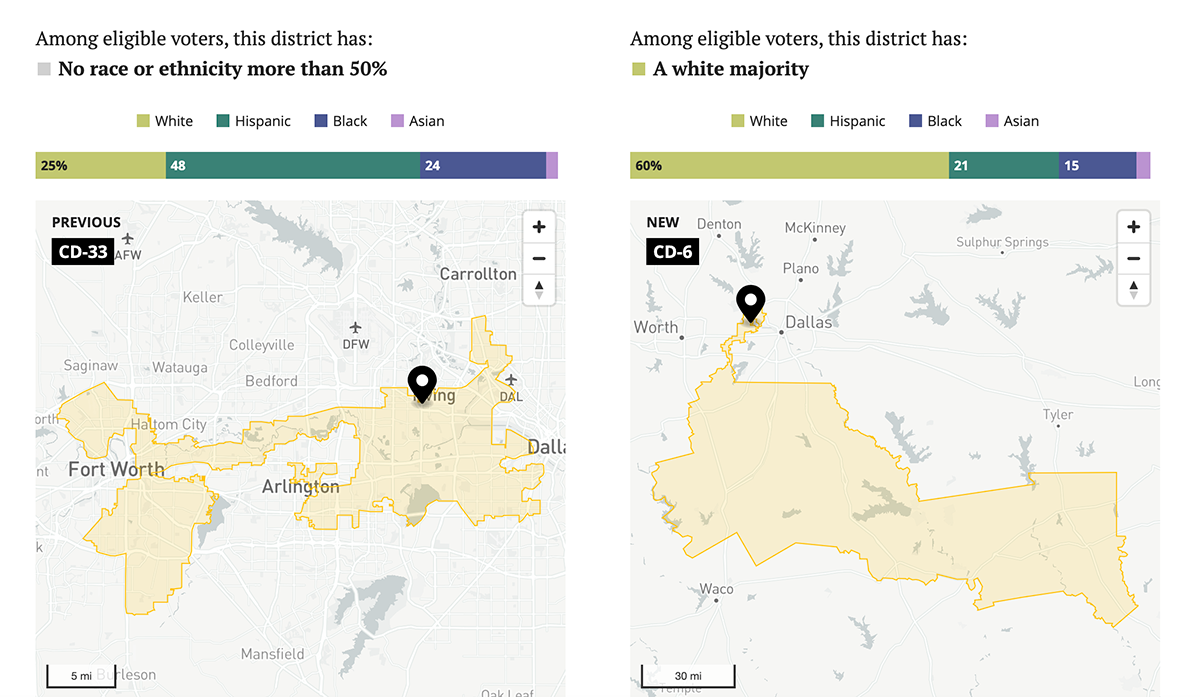
Texas has new political maps. See which districts your home is in.
A tool where Texans can look up their address and find out how their congressional, state house, state senate and state board of education districts have changed. View
Role:
design
front end development
data scraping
Skills: html css javascript python mapbox
Skills: html css javascript python mapbox
The 2021 legislative session is over. Here are the big bills that passed – and the ones that failed
A tracker that keeps track of bills during the 2021 regular legislative session. It includes which ones passed and which ones failed. View
Role:
design
front end development
Skills: html css javascript
Skills: html css javascript
COVID-19 ravaged Texas nursing homes. Here are the stories behind the numbers.
A story that through scrollytelling goes through a year of COVID deaths in Texas nursing homes while contextualizing it with stories of the people who lived through it. View
Role:
data analysis
design
front end development
Skills: html css react d3 node.js python
Skills: html css react d3 node.js python
The Texas Tribune COVID-19 tracker
A COVID-19 tracker in Texas that updated with the latest number of COVID-19 cases, deaths, hospitalizations. The page went through several iterations and contributions from several members of the data team until it was finally sunsetted in 2022. View
Role:
design
front end development
back end development
Skills: html css react d3 node.js python
Skills: html css react d3 node.js python
In 2021, white men are still overrepresented in the Texas Legislature
A story that, through several dot graphics, analyzed the demographic makeup of the elected officials in Texas legislature right before the session started. View
Role:
design
front end development
analysis
Skills: html css react
Skills: html css react
The Force Report
A database where readers can New Jersey town or police officer and find their use-of-force statistics based on data given to us by law enforcement agencies. The comprehensive data was the first of its kind gathered in New Jersey, leading the state to reform its laws on police data transparency. View
Role:
design
front end development
back end development
analysis
Skills: html css javascript d3 django
Skills: html css javascript d3 django
The Outage Tracker
A scraper that gets real-time power outage data from all four major New Jersey utility companies and feeds it to several live, updating charts and maps which are then embedded into stories during any major outage events. View
Role:
web scraping
design
front end development
Skills: html css javascript d3 python
Skills: html css javascript d3 python
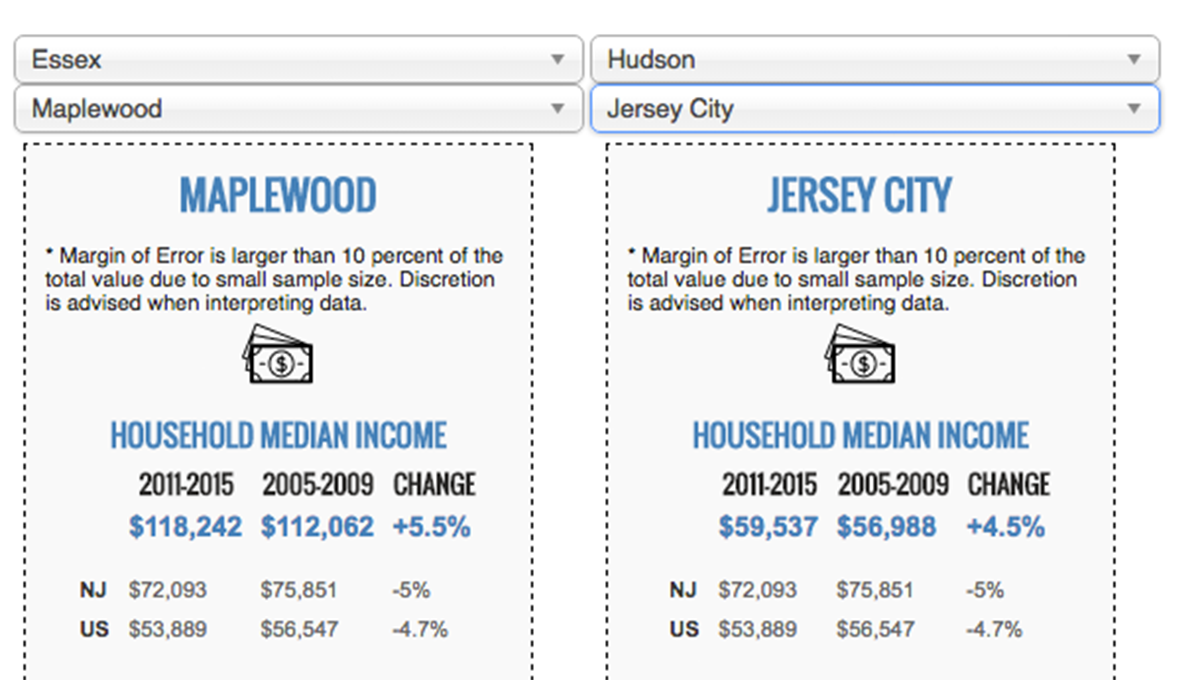
Census Comparison Tool
A head-to-head comparison tool where readers use a dropdown menu to compare data between two entities. In this example, readers compare the latest Census data of two towns or counties. View
Role:
design
front end development
Skills: html css javascript
Skills: html css javascript
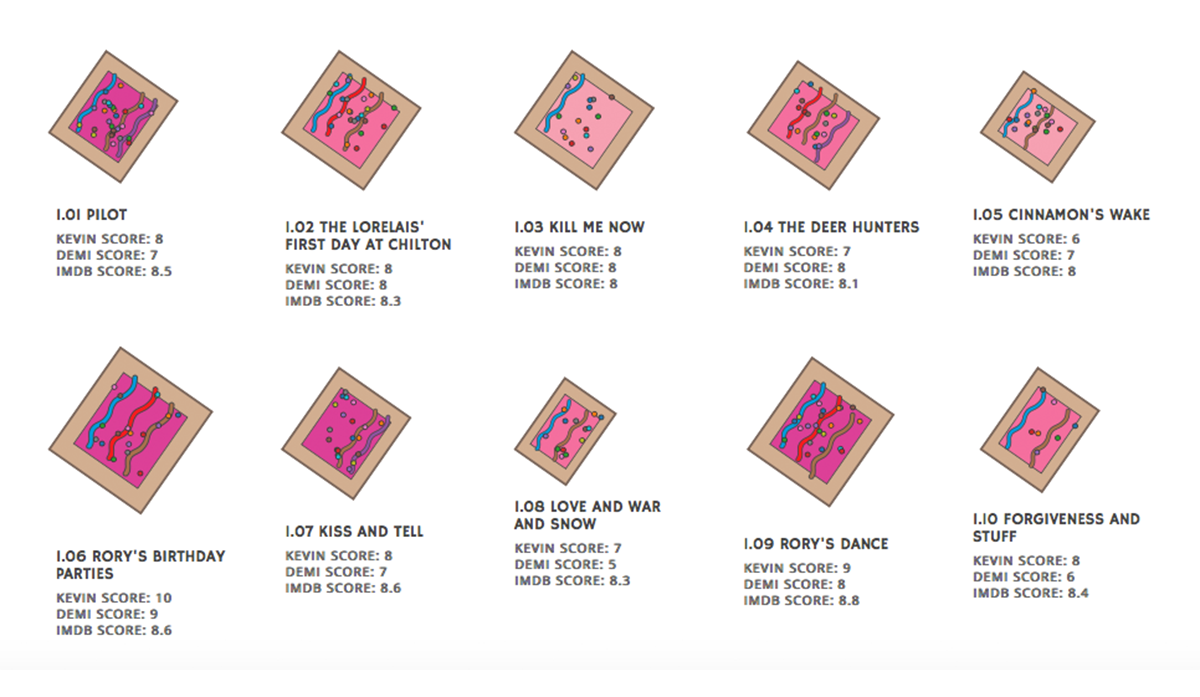
All Gilmore Guys ratings of all Gilmore Girls episodes... reimagined as pop tarts
A Pop-Tart generator of all episodes of the TV show, Gilmore Girls, based on scores from the Gilmore Guys podcast and other metrics. This makes every Pop-Tart unique! View
Role:
data analysis
design
front end development
Skills: html css javascript d3
Skills: html css javascript d3
How Zika Can Spread
A graphic made for an International Business Times article showing and explaining how the Zika virus spread in Brazil. View
Role:
design
front end development
research
Skills: html css javascript d3
Skills: html css javascript d3
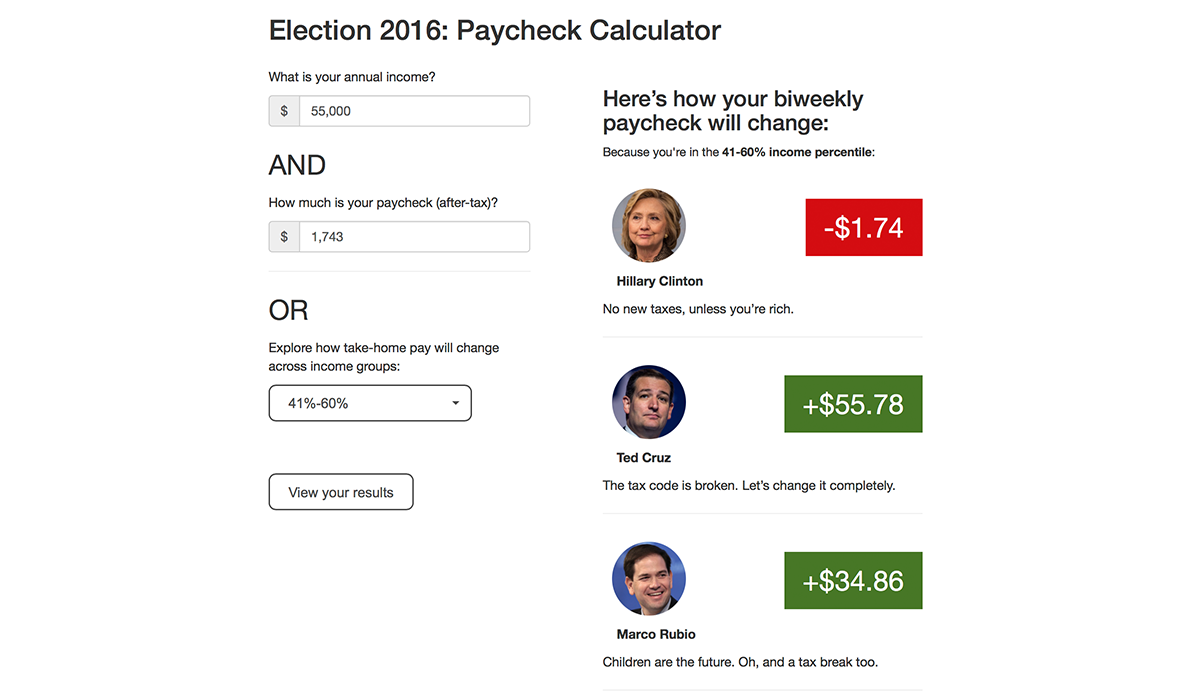
Election 2016: Paycheck Calculator
A calculator that uses data from the Tax Policy Center to tell readers how much money will be added or taken away from your bi-monthly paycheck based on each 2016 presidential candidates' tax plan. View
Role:
design
front end development
analysis
Skills: html css javascript
Skills: html css javascript
Arrest-related deaths in New Jersey
A database of 10 years of arrest-related deaths in New Jersey, including police shootings, "excited delirium" deaths and suicides. In addition, an interactive graphic shows a by-the-numbers breakdown of the arrest-related death reports. View
Role:
design
front end development
back end development
Skills: html css javascript ruby on rails
Skills: html css javascript ruby on rails
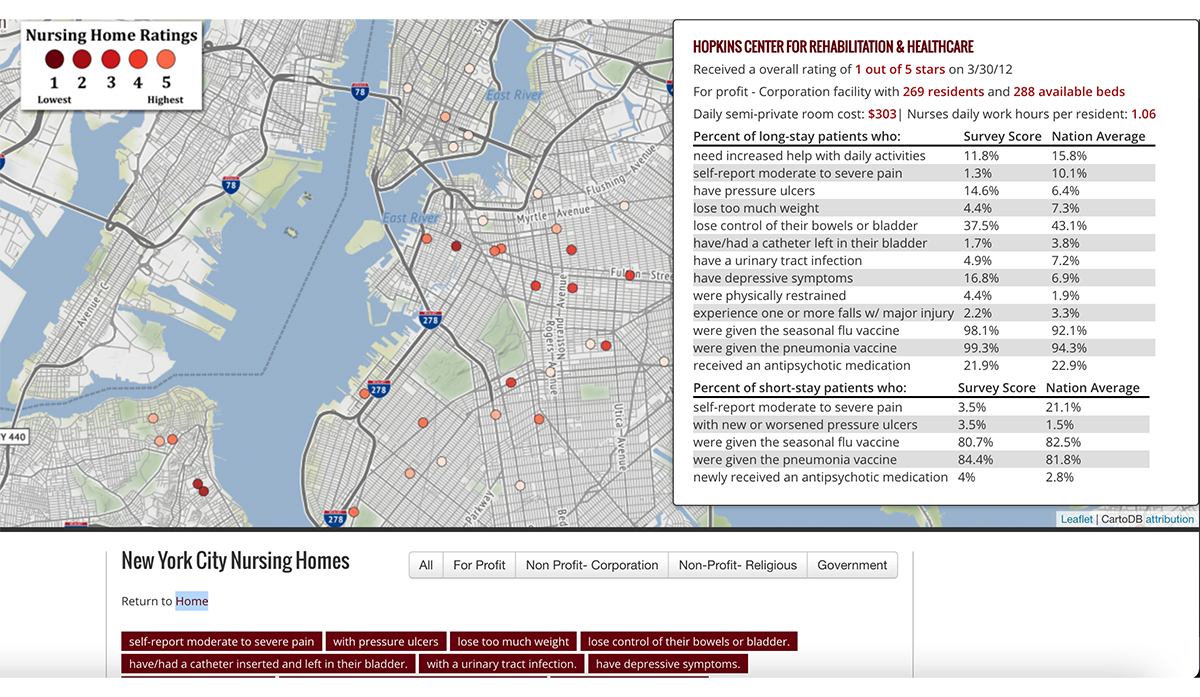
School Project Nursing Home
A school project that analyzed and contextualized New York City nursing home inspection scores and violations. The site includes a map of nursing home scores and database of violations. View
Role:
design
front end development
back end development
analysis
Skills: html css javascript leaflet cartodb
Skills: html css javascript leaflet cartodb
Resume
Experience
Senior Data Developer for The Texas Tribune | Austin, TX
Jul 2019 - PresentAs senior data developer, I create visual graphics with a focus on Texas elections and political data using code and graphics software. In particular, I'm lead developer of our live election result pages along with other election products. I also obtain, sometimes through web scraping, and analyze data sets used in accountability stories. In addition, I'm lead developer on several Django-based apps including a Texas Tribune API that powers our officeholder directory and live election results.
Data Reporter and Visual Journalist for NJ Advance Media (NJ.com/The Star-Ledger) | Iselin, NJ
Aug 2016 - Jun 2019 and Nov 2013 - Sep 2015As data reporter, I found stories in New Jersey data sets and created interactive data graphics and visuals to tell those stories. I was also lead news app developer on several projects, which included building a database of police use of force in the state as part of a 16-month investigative project.
Deputy Data Visuals Editor for International Business Times | New York City
Oct 2015 - Jul 2016As deputy data visuals editor, I gathered data and built graphics for stories featured on the International Business Times site.
Intern for Patch.com | New York City
May 2013 - Aug 2013As a data interactive reporting intern, I helped take national data sets and created embeddable and localized interactive graphics for stories in local Patch sites.
Intern for USA Today | Washington D.C.
Jun 2012 - Aug 2012As data investigative intern, I wrangled, cleaned and analyzed data for the USA Today's Data Investigative Desk.
Education
Craig Newmark Graduate School of Journalism | New York City
Aug 2011 - Dec 2012I graduated with a master's degree in journalism and took classes in data, coding, video and audio journalism.
University of Florida | Gainesville, FL
Aug 2005 - May 2009I graduated with a bachelor's degree in journalism and a bachelor's degree in theater costume design.
Accolades
2022 Texas Medical Association In-Depth Print/Online News Winner for "COVID-19 ravaged Texas nursing homes. Here are the stories behind the numbers."
2021 2nd Place Infographics Winner Texas Association of Managing Editors for "COVID-19 ravaged Texas nursing homes. Here are the stories behind the numbers."
2021 3nd Place Community Service Winner Texas Association of Managing Editors for "Texas has new political maps. See which districts your home is in."
2019 Finalist for Livingston Award for Young Journalists for "The Force Report"
2019 Investigative Reporters and Editors Freedom of Information Award for "The Force Report"
2019 University of Florida Award for Investigative Data Journalism for "The Force Report"
2019 The James L. Knight Foundation award for Public Service for "The Force Report"
2019 New York Press Club Award in Crime Reporting for "The Force Report"
2019 NAACP President's Freedom Fighter Award for "The Force Report"
2019 New Jersey Press Association Best Web Project for "The Force Report"
2019 SPJ-NJ Best Investigation of the Year for "The Force Report"
2019 SPJ-NJ Tim O'Brien Award: Best Use of Public Records (Second Place) for "The Force Report"
2018 New Jersey Press Association Innovation Award Skills for "In their words: 50 years after the riots"
2018 New Jersey Press Association Best Multimedia Element for "In their words: 50 years after the riots"
2017 New Jersey Press Association Innovation Award Skills for "Census Comparison Tool"
2015 New Jersey Press Association First Amendment - Art Weissman Memorial Award for "Guns, armor and a grenade launcher: Do N.J. cops need weapons of war?"
2015 New Jersey Press Association Best Multimedia Element for "The Sandy Scorecard"
2013 CUNY Hillman Prize for Social Justice Reporting for "Data visualization of nursing homes scores in NYC (School Project)"